The story behind the shopping cart.
From raw retail transactions to a clearer view of customers, subscriptions, and purchase behavior.
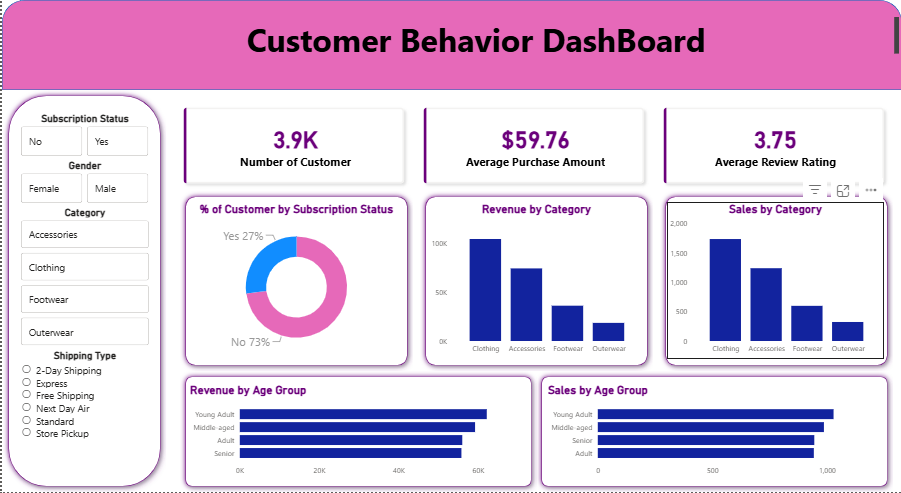
What makes a customer come back?
Purchase records contain plenty of activity, but the useful questions are about behavior: who returns, what they value, and how subscriptions and discounts relate to spending.
Connect customer demographics, purchase history, and product information in an analysis that supports practical marketing and retention decisions.
Make the data dependable
Inspected 3,900 purchases across 18 fields. Imputed 37 missing review ratings with each product category’s median, standardized column names, and checked redundant promotion fields.
Ask business questions in SQL
Loaded the prepared data into SQL Server using Python and pyodbc. Used aggregate queries, CTEs, and window functions to compare shipping types, subscription status, revenue by age group, highly rated products, and New, Returning, and Loyal customer segments.
Build a readable decision surface
Created an interactive Power BI dashboard with customer, spending, review, and product-category views, then translated the analysis into recommendations for loyalty, subscriptions, discount policy, and product positioning.
Who subscribes—and who might?
The dashboard records 27% subscribers and 73% non-subscribers. The analysis compared spending and repeat purchases across those groups, then proposed clearer subscription benefits.
Subscription status is an observed attribute. This comparison does not prove that subscribing causes loyalty.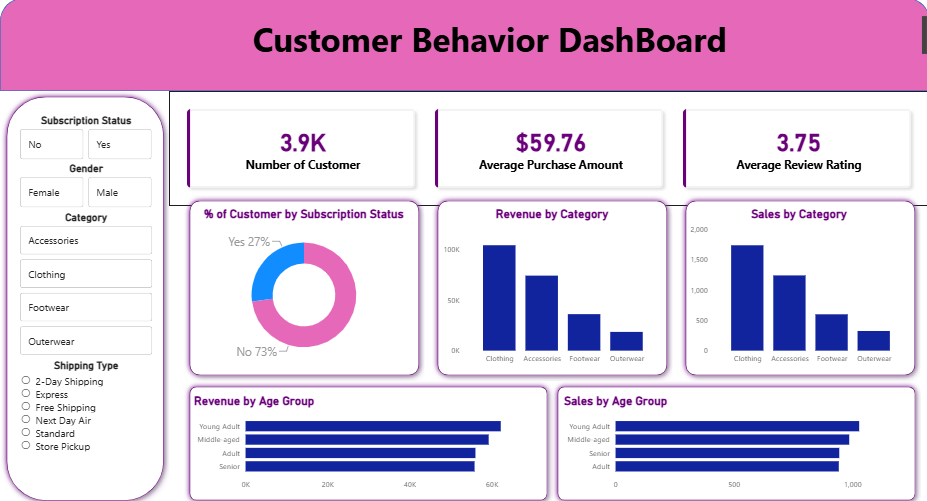
What the work delivers.
A complete Python-to-SQL-to-Power BI workflow, with a documented report and recommendations that connect customer behavior to business decisions.
A useful dashboard starts with well-defined business questions and reliable fields. Category-level imputation retained the purchase records while accounting for differences in product ratings.
Project scopeThis is an analytical portfolio project. Recommendations were proposed; revenue growth or retention improvements were not measured. Associations do not establish causation.